Category Analysis Report
Compare your product categories by revenue, margin, and growth.
Which categories make you the most money?
Category Analysis (Reports → Categories) groups sales by product category so you can see where revenue and margin really come from.
Available on the Growth plan.
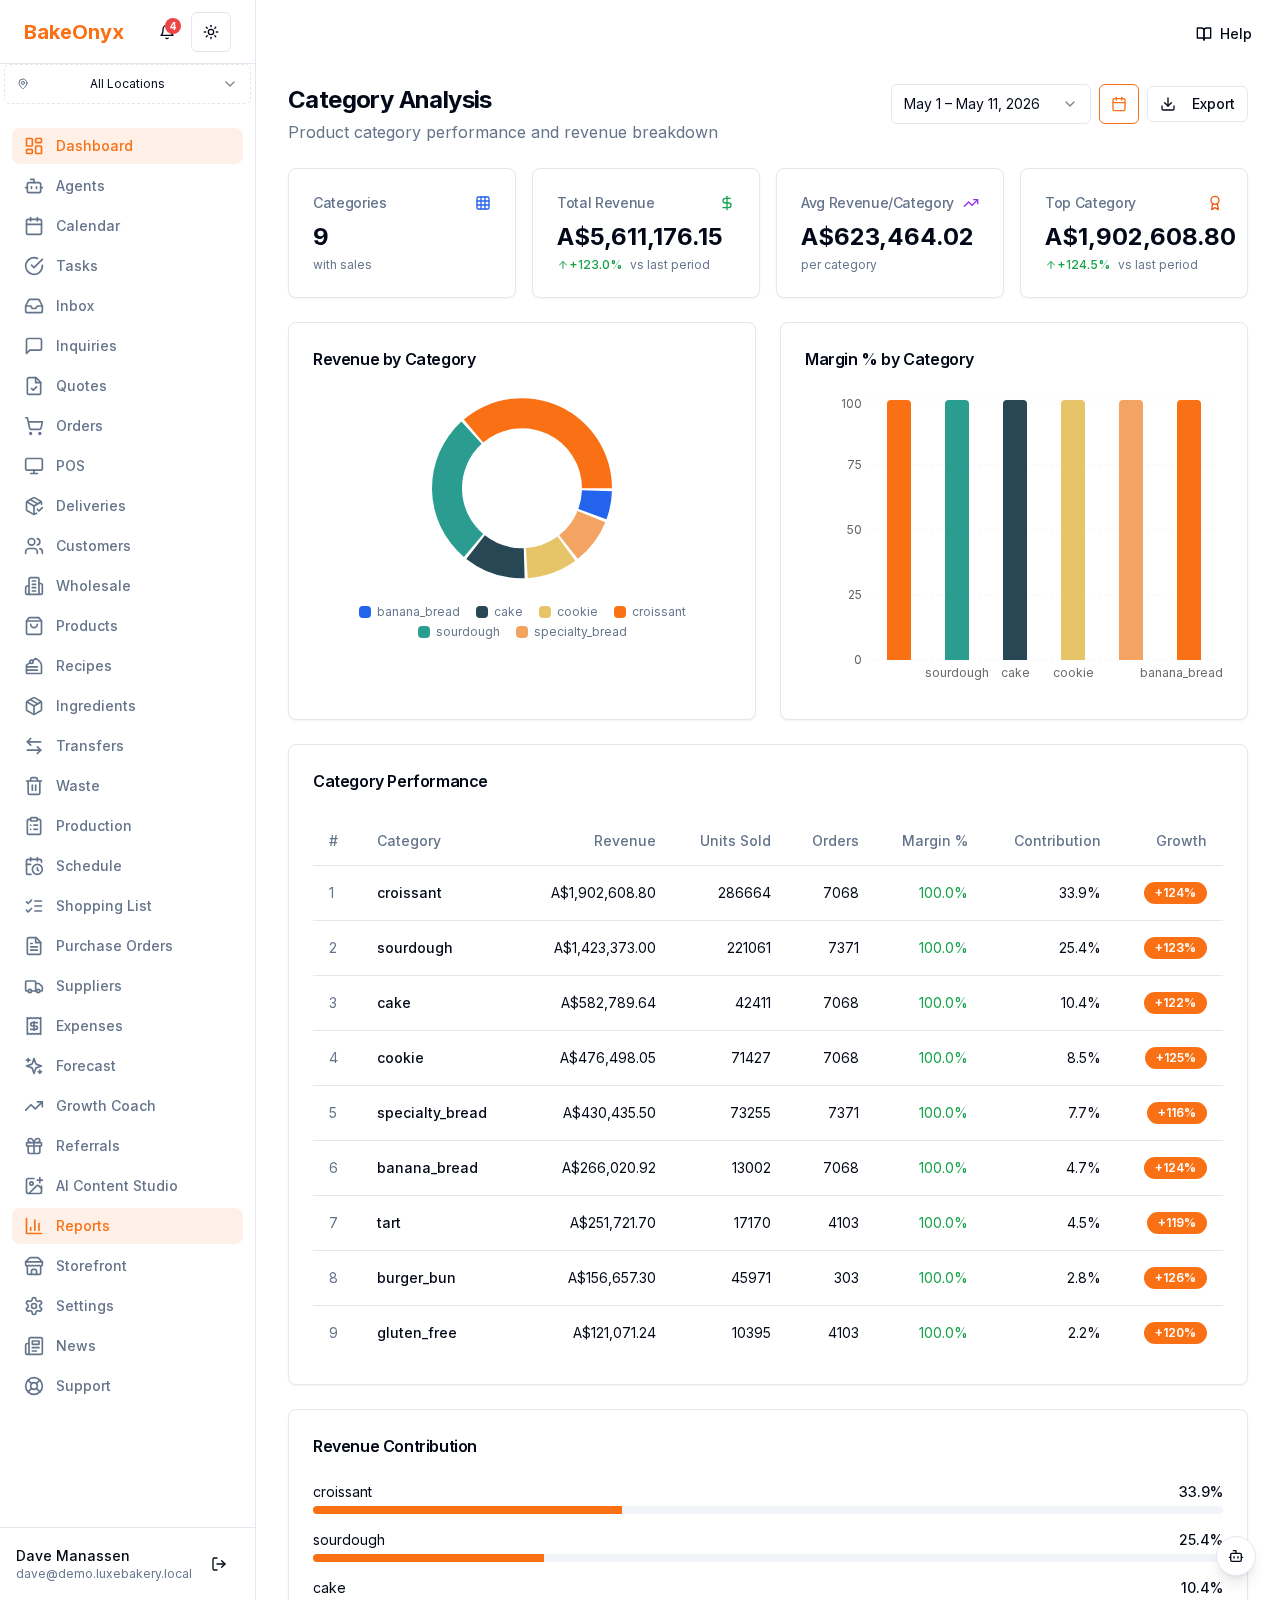
What it shows
- Cards: number of categories, total revenue, average revenue per category, top category
- A Revenue by category pie and a margin % by category bar
- A Category Performance table (revenue, units, orders, margin %, contribution, growth)
- A revenue contribution breakdown for your top categories
How to use it
Lean into high-margin categories and rethink low-margin ones (raise prices or cut costs). Watch the growth column to spot rising and fading categories early.
Next steps
Was this article helpful?