Seasonal Analysis Report
Compare sales month-by-month year-over-year to plan for peaks and quiet spells.
How does your year ebb and flow?
Seasonal Analysis (Reports → Seasonal) compares this year to last, month by month, so you can plan ahead for your busy and quiet seasons.
Available on the Growth plan.
What it shows
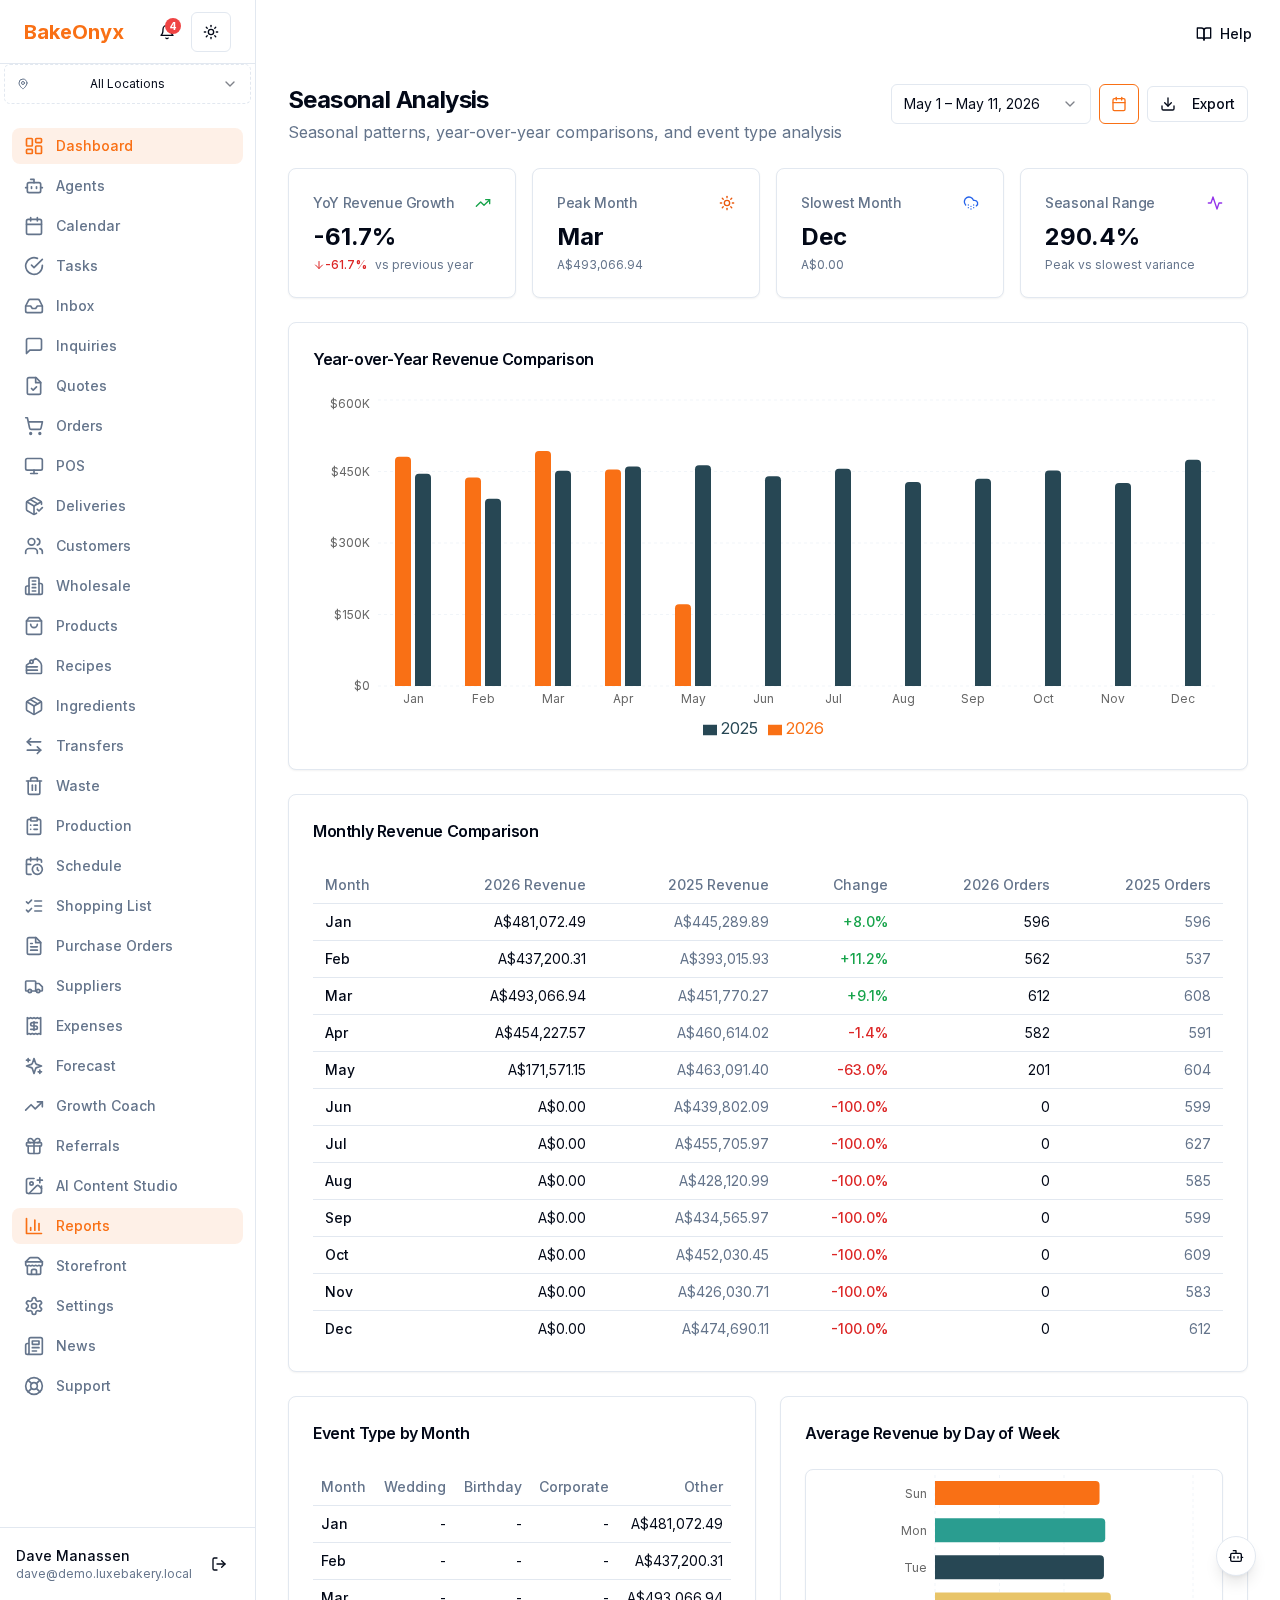
- Cards: year-over-year revenue growth, peak month, slowest month, seasonal range
- A year-over-year comparison chart and average revenue by day of week
- A monthly revenue comparison table (this year vs last, change %, orders)
- Revenue by event type per month, where your orders are tagged
How to use it
Build your production and hiring plan around the peaks, and create offers to fill the troughs. Needs at least a year of history to compare — it gets more useful every month.
Next steps
Was this article helpful?