Inventory Usage Report
See which ingredients you use most and what they cost you.
What are you consuming, and what does it cost?
Inventory Usage (Reports → Usage) shows which ingredients are consumed most and the cost impact over a period.
Available on the Growth plan.
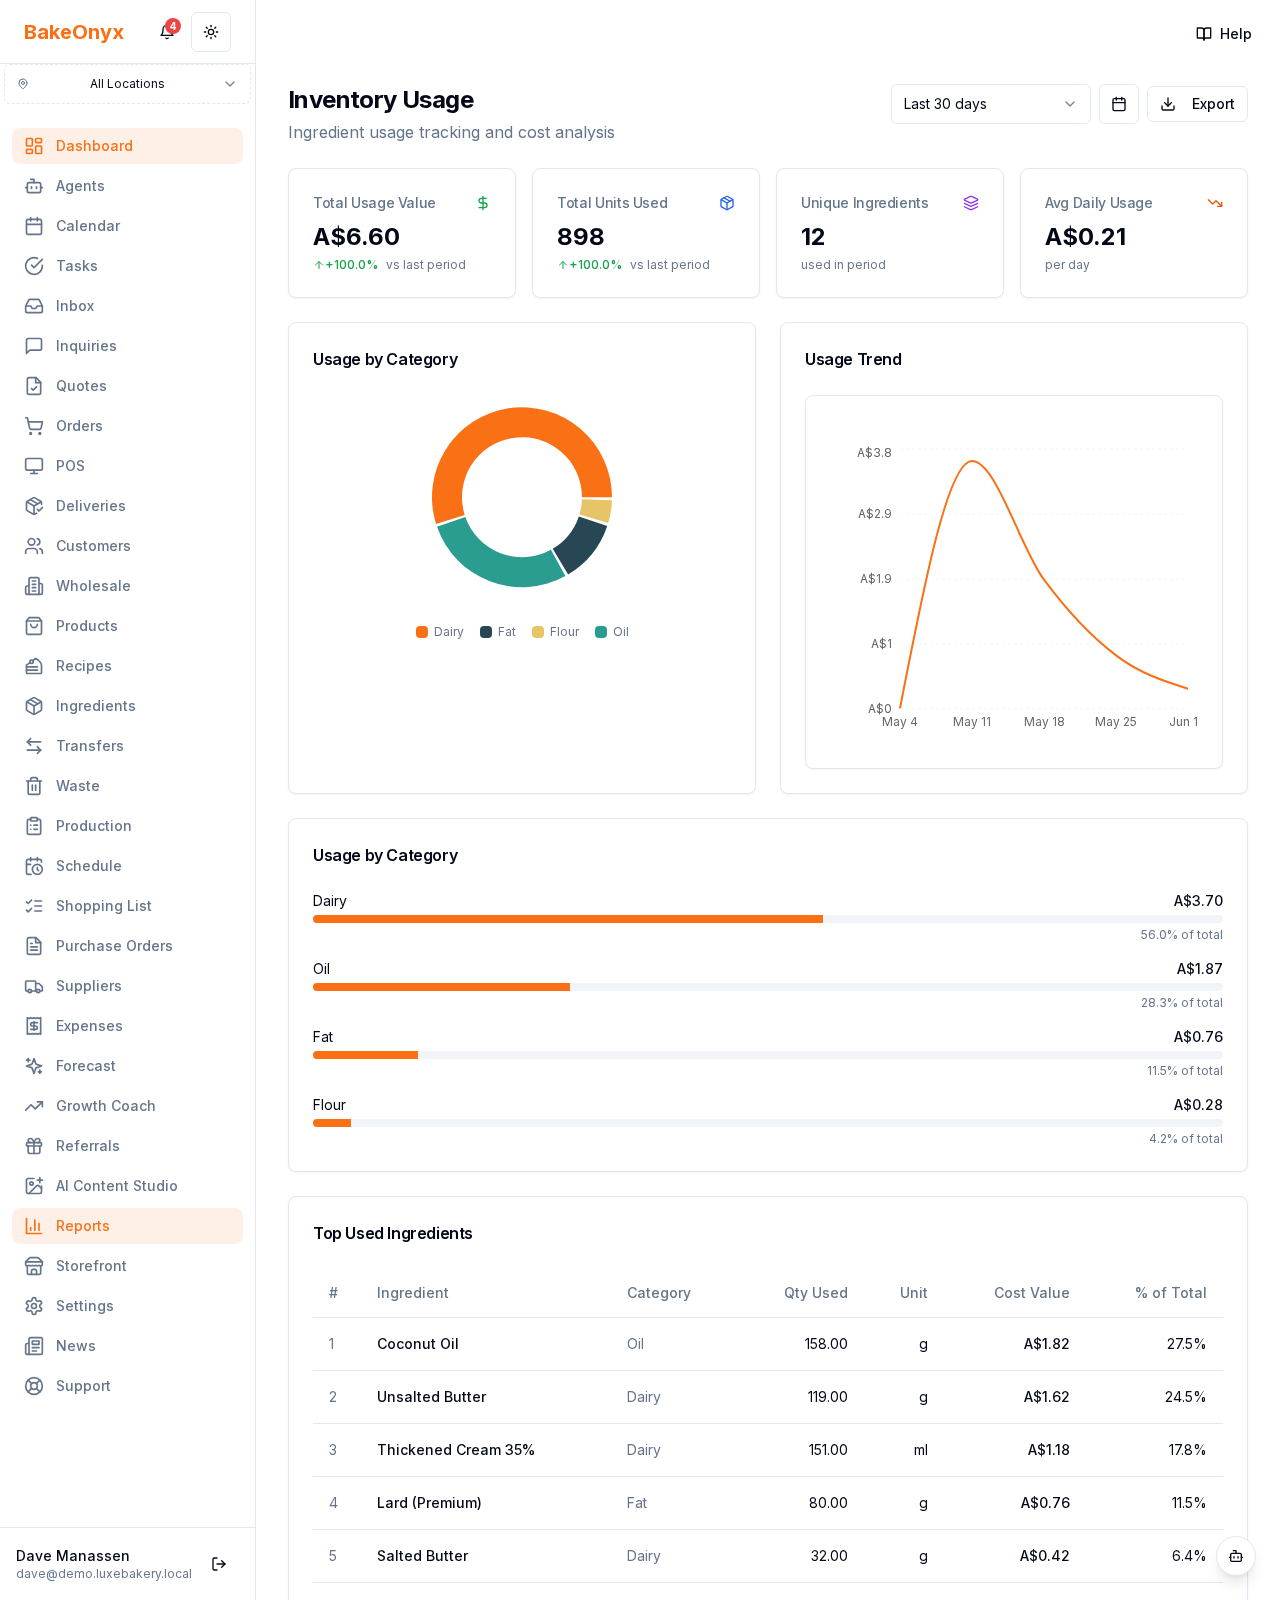
What it shows
- Cards: total usage value, total units used, unique ingredients, average daily usage value
- A usage by category pie and a usage trend
- A top used ingredients table (quantity used, cost value, share of total)
How to use it
Focus cost-saving on your highest-value ingredients, negotiate better prices on the big ones, and spot unusual spikes. Pair with Purchasing and Waste to see the full ingredient lifecycle.
Next steps
Was this article helpful?