Demand Forecast Overview
View AI-generated demand predictions for your products based on historical order data and external factors.
Demand Forecast Overview
- Understand how BakeOnyx predicts customer demand for your products
- Read and interpret the demand forecast dashboard and predictions table
- Use forecast data to plan production and manage inventory
What is Demand Forecasting?
The Demand Forecast feature uses artificial intelligence to predict how many of each product your customers will order in the coming week. Instead of guessing, BakeOnyx analyzes your actual order history, day-of-week patterns, and seasonal trends to give you smart, data-driven predictions. This helps you bake the right amount of product at the right time—reducing waste and preventing stockouts.
Demand forecasting is a Growth+ tier feature, so you'll need an active Growth+ subscription to access it.
Accessing Your Demand Forecast
- Log into your BakeOnyx dashboard
- Click Forecast in the left navigation menu
- You'll land on the Forecast page, which displays your demand predictions for the coming week
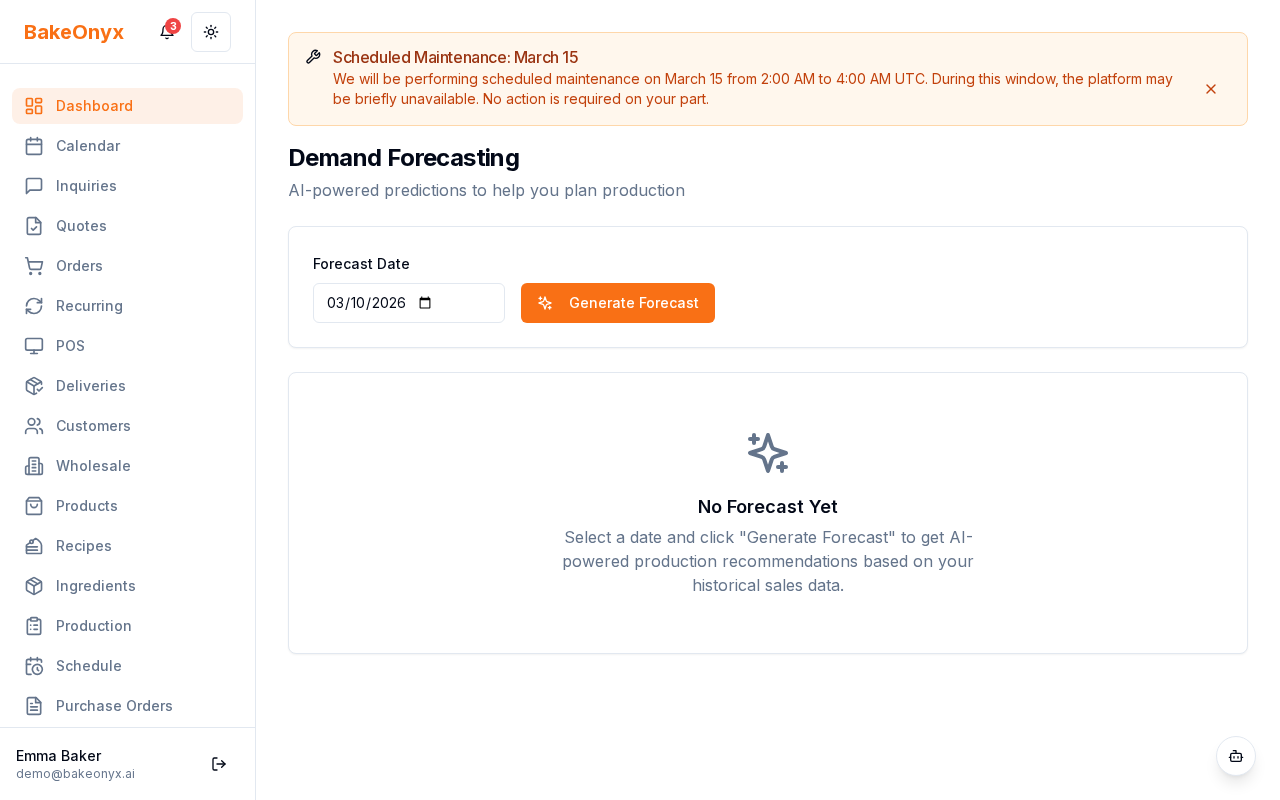
Reading the Forecast Dashboard
At the top of the Forecast page, you'll see a summary card showing:
- Predicted demand for the coming week — the total quantity BakeOnyx expects you to sell across all products
- Confidence level — a percentage indicating how confident the AI is in its prediction (higher is better)
- Comparison to last week — whether demand is expected to go up, down, or stay stable
Use this summary to get a quick sense of your upcoming week's workload. A high confidence level (80%+) means you can rely on the forecast more heavily for production planning.
Understanding the Predictions Table
Below the summary, the Predictions Table breaks down demand by individual product. Here's what each column tells you:
- Product Name — the name of your product
- Forecasted Quantity — how many units the AI predicts you'll sell this week
- Historical Average — the typical weekly quantity you've sold in the past
- Trend — whether demand is trending up (↑), down (↓), or stable (→)
- Confidence — how confident the AI is in this specific product's forecast

For example, if your sourdough loaf shows a forecast of 120 units with an upward trend (↑), that means the AI expects you to sell more sourdough than usual this week, likely based on past patterns or seasonal factors.
What Happens If There's Not Enough Data?
New products or products with fewer than 30 days of order history will show a "Not enough data" indicator instead of a forecast. This is normal. Keep recording orders, and once you have 30+ days of history, BakeOnyx will start generating predictions for that product.
Using Forecasts in Your Workflow
Demand forecasts are designed to feed into your broader planning workflow:
- Production Scheduler — use forecast quantities to schedule baking shifts and ingredient prep
- Inventory Planning — ensure you have enough ingredients on hand to meet predicted demand
- Staffing — adjust staff schedules based on expected production volume
The forecast is a starting point, not a guarantee. Always factor in your own knowledge—upcoming events, holidays, promotions, or weather can all affect actual demand.
Next Steps
- Learn about Forecast Insights and Context Factors — understand what influences your predictions
- Production Scheduler Overview — use your forecast to plan baking schedules
- Adding and Managing Ingredients — ensure you have the right inventory to meet demand
The summary, FAQ, and statistics in this section were compiled from public sources and reviewed by the BakeOnyx editorial team. AI-assisted research.
Frequently Asked Questions
How does BakeOnyx predict demand for my bakery?▾
BakeOnyx uses artificial intelligence to analyze your past order history, identify daily and weekly patterns, and recognize seasonal trends. This data-driven approach generates predictions for how many of each product customers are likely to order in the upcoming week, moving beyond guesswork to optimize production.
What information is available on the BakeOnyx demand forecast dashboard?▾
The dashboard provides a quick overview of your predicted demand for the coming week, including the total expected sales quantity across all products. It also shows the AI's confidence level in its prediction and a comparison to the previous week's demand, indicating whether it's expected to increase, decrease, or remain stable.
How do I interpret the predictions table in BakeOnyx?▾
The predictions table breaks down demand by individual product. It lists the forecasted quantity, your historical average sales, a trend indicator (up, down, or stable), and the AI's confidence level for that specific product's forecast. This allows for detailed planning for each item you offer.
What does a high confidence level mean in BakeOnyx's demand forecast?▾
A high confidence level, ideally 80% or more, signifies that the AI is very certain about its demand prediction for the week or a specific product. This means you can rely more heavily on the forecast for accurate production planning and inventory management, minimizing potential errors.
What happens if a product doesn't have a demand forecast in BakeOnyx?▾
If a product shows 'Not enough data,' it means it has less than 30 days of order history. BakeOnyx needs this minimum data period to generate reliable AI predictions. Continue recording orders, and forecasts will become available for that item once sufficient historical data is collected.
Can I use the demand forecast if I have new products?▾
For new products or those with insufficient historical data (under 30 days), BakeOnyx will indicate 'Not enough data.' In such cases, you can manually input your best estimate for the forecast or rely on your own experience and judgment for initial production planning until the AI can generate data-driven predictions.