Sales Overview Report
Your top-line numbers — revenue, orders, average order value, and growth — with trends and best sellers.
How is the business doing?
The Sales Overview is the single dashboard to glance at to know whether the bakery is growing — and where the growth is coming from.
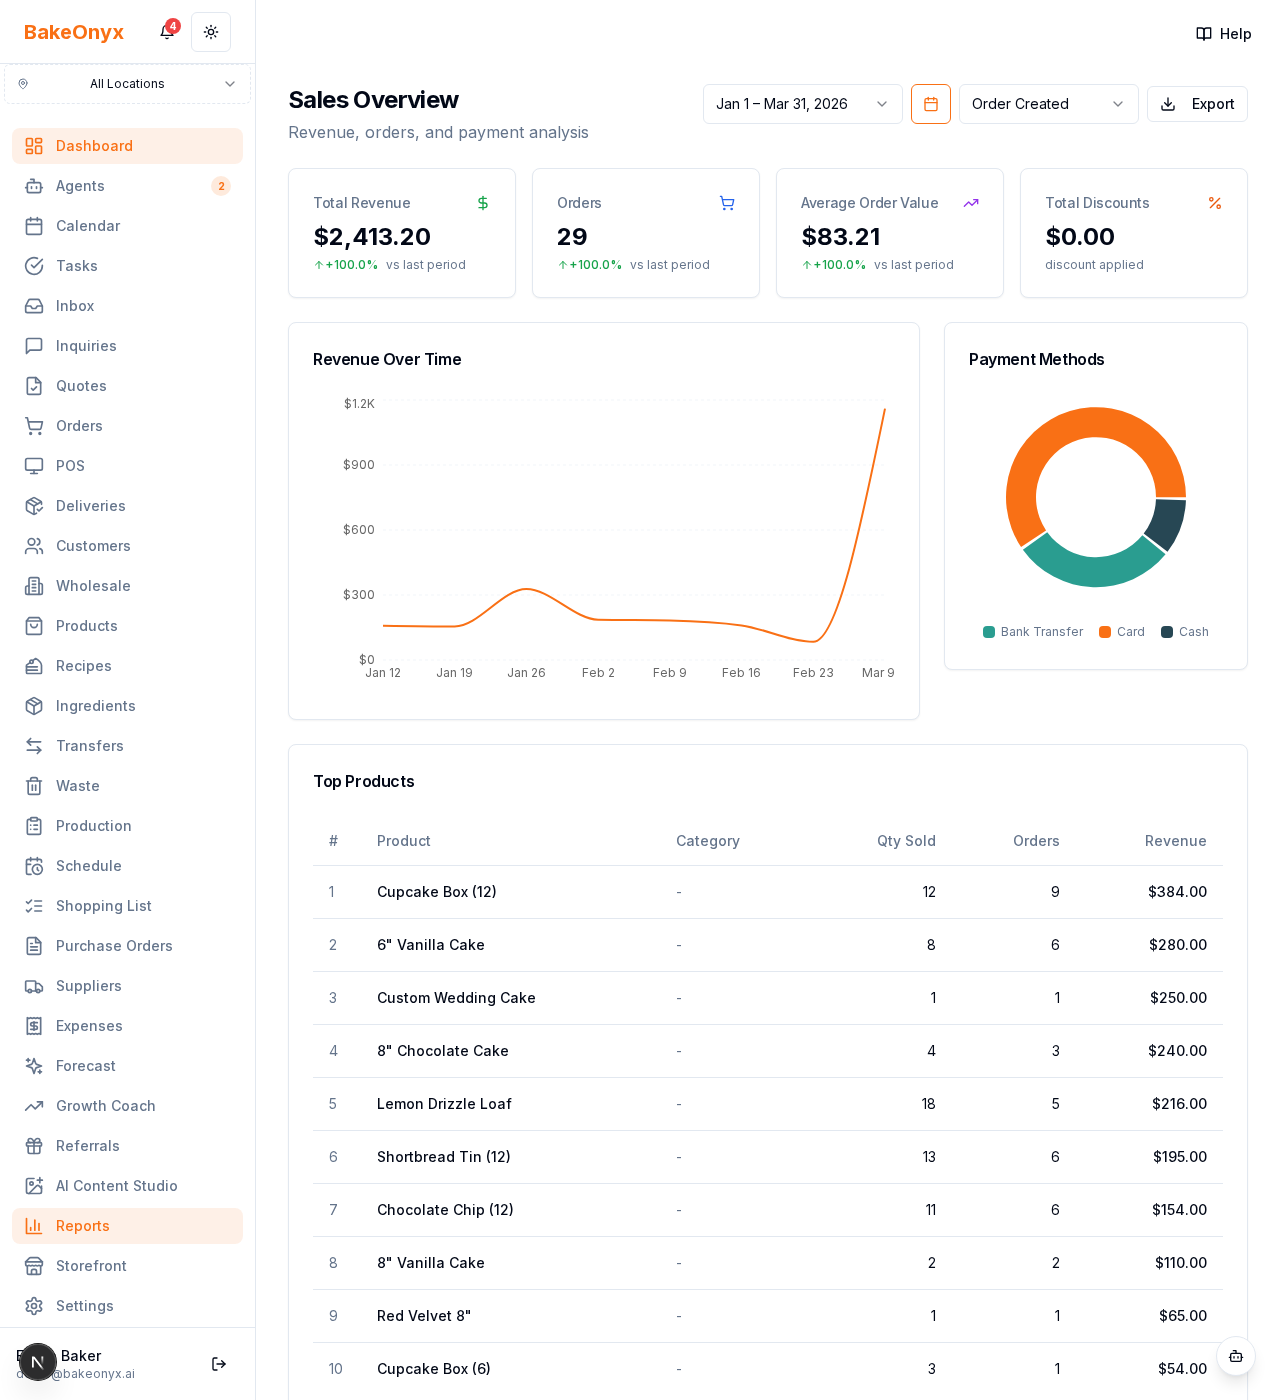
What it shows
- Total revenue, total orders, average order value, and order growth for the period you pick
- A revenue trend chart
- Your best-selling products and categories
How to use it
- Compare periods (this month vs last) to spot momentum.
- Watch average order value to see whether upsells and bundles are working.
- Use the best-seller list to plan production and promotions.
Change the date range at the top to zoom into a week, a month, or a season, and export to PDF or CSV.
Was this article helpful?